Hello
I’m making line chart using chart.js library
I install it by npm install chart.js --save.
anyway.
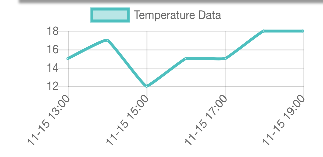
my chart is shown below
the problem is that I made 7 data to show , but it only display 4 data. I thought I can scroll to axis but no…
how can I display many x axis data?
I tweaked a bit of example code.
my code is
 setTimeout(()=>{
      this.lineChart = new Chart(this.lineCanvas.nativeElement, {

        type: 'line',
        data: {
            labels: ["11-15 13:00", "11-15 14:00", "11-15 15:00", "11-15 16:00", "11-15 17:00", "11-15 18:00", "11-15 19:00"],
            datasets: [
                {
                    label: "Temperature Data",
                    fill: false,
                    lineTension: 0.1,
                    backgroundColor: "rgba(75,192,192,0.4)",
                    borderColor: "rgba(75,192,192,1)",
                    borderCapStyle: 'butt',
                    borderDash: [],
                    borderDashOffset: 0.0,
                    borderJoinStyle: 'miter',
                    pointBorderColor: "rgba(75,192,192,1)",
                    pointBackgroundColor: "#fff",
                    pointBorderWidth: 1,
                    pointHoverRadius: 5,
                    pointHoverBackgroundColor: "rgba(75,192,192,1)",
                    pointHoverBorderColor: "rgba(220,220,220,1)",
                    pointHoverBorderWidth: 2,
                    pointRadius: 1,
                    pointHitRadius: 10,
                    data: [15, 17, 12, 15, 15, 18, 18],
                    spanGaps: false,
                }
            ]
        }

    });
    },1000)