How to integrate D3JS with Ionic 2?

Hello,

How can we integrate D3JS charts with Ionic 2?

I need to develop some charts like Donut Charts / Bar Charts in D3JS. Below is the sample code I have found for Donut Chart.


It is in JavaScript. Can we use it in Ionic 2 with TypeScript?
Is it work if we create android or ios app from Ionic 2 with “ionic run android --prod --release” command?

Google for Angular 2 + D3JS :wink:

in most cases if you need to use third party lib --> use npm to install them, check if there are already types for the lib.

Import the lib, where you want to use it

1 Like

@bengtler

I have followed the example provided by you in your reply.
I have created one pie chart in my Ionic project.

Please find below snapshots:

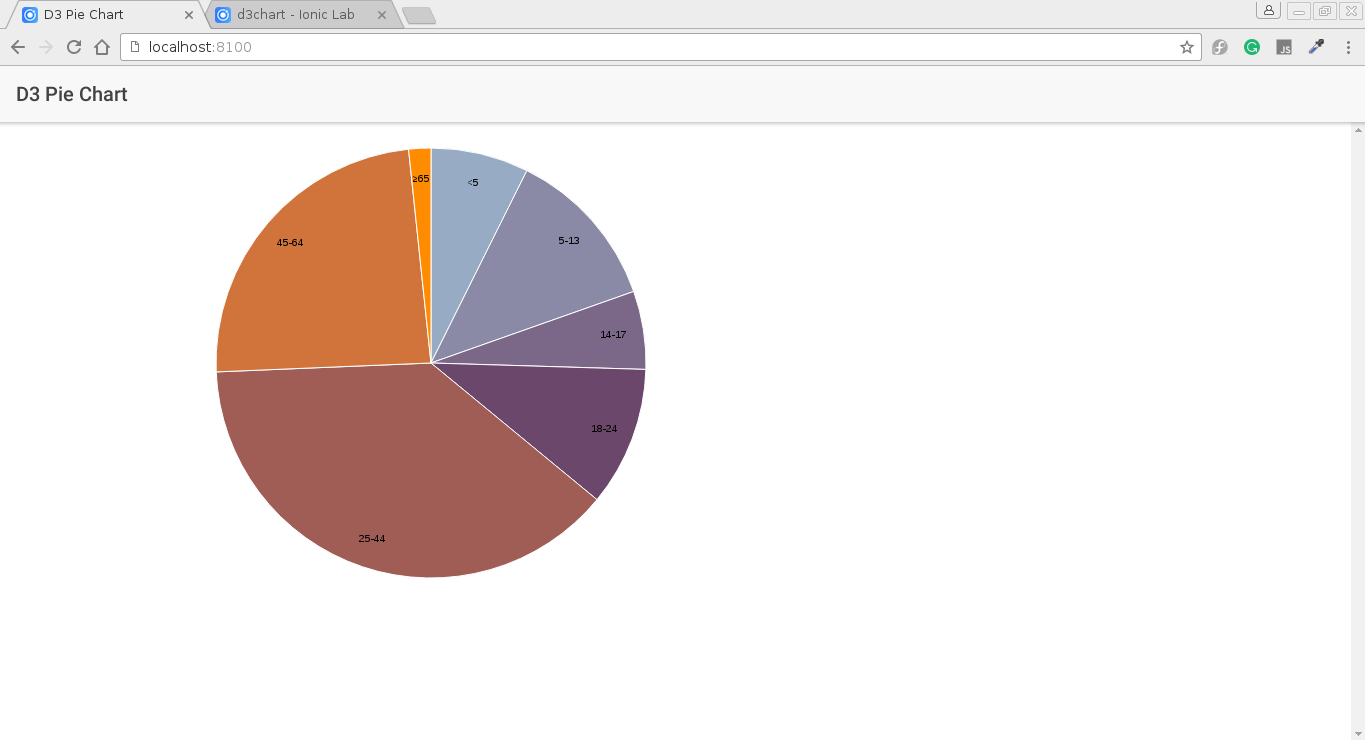
For desktop view, it is looking pretty good
But for mobile view, Chart is not properly visible. It seems that chart does not support responsive nature.
Please help.

I noticed that the template looks like something like this.

@Component({ selector: 'app-root', template: <h1>{{title}}</h1> <h2>{{subtitle}}</h2> <svg width="960" height="500"></svg> })

You could try changing the width and height attributes of the svg element to values which you can control in the class.

yeah you can set width and height with vw and vh untis

or follow something like this:
http://jsfiddle.net/BTfmH/12/

I have changed my code with this… and it works for both desktop and mobile view :grinning:

this.svg = d3.select("svg")
            .attr("width", '100%')
            .attr("height", '100%')
            .attr('viewBox','0 0 '+Math.min(this.width,this.height)+' '+Math.min(this.width,this.height))
            .append("g")
            .attr("transform", "translate(" + Math.min(this.width,this.height) / 2 + "," + Math.min(this.width,this.height) / 2 + ")");

I followed the angular2 + d3 examples, Not able to load chart, I tried with
package.json
"@types/d3-scale": "^1.0.8", "@types/d3-selection": "^1.0.15", "@types/d3-shape": "^1.1.0", "d3": "^4.2.6",

in .ts
import * as d3 from 'd3-selection'; import * as d3Scale from "d3-scale"; import * as d3Shape from "d3-shape" d3.select('doNutChart').append('<p>Hi this para</p>');

.html

<div id="doNutChart"></div>

I am unable to load the d3 or create the chart using d3.
Just for trial I tried appending a para

Any clue on what is going wrong, ?